Friday 28 December 2012

The State of Social Media 2012

This infographic by The SEO Company goes through the most memorable events related to social media in 2012. There is a section for each month and the infographic includes events such as Barrack Obama's victory, the Facebook IPO and much more.

The State of Social Media 2012

Monday 17 December 2012

Smartphones: Devoted Users

Another infographic from Coupon Audit that presents some interesting information on the use of smartphones. It includes some great statistics including 65% of iPhone users surveyed saying they couldn't live without their iPhone. Smartphone Devoted Users

Divorce in America

An infographic published by Low Price Law centred around divorce in America. It goes through why people get divorced, states 50% of marriages end in divorce, asks if we are getting married too young and more.

Divorce in America

History of the Christmas Tradition

This infographic on the history of christmas traditions was created by Balsam Hill. It goes through various christmas traditions and their origins from the publishing of the twelve days of christmas to how father christmas ended up in a red suit.

Gangnam Style

This infographic is about Gangnam style, a new kind of music from Korea. It contains a number of stats centred around Gangnam style, the Gangnam area itself and the artist Psy, who's song 'Gangnam style' hit number one on the youtube 100. It was released by coupon audit. Gangam Style

Thursday 13 December 2012

The Biggest Underdog Payouts in Sports History

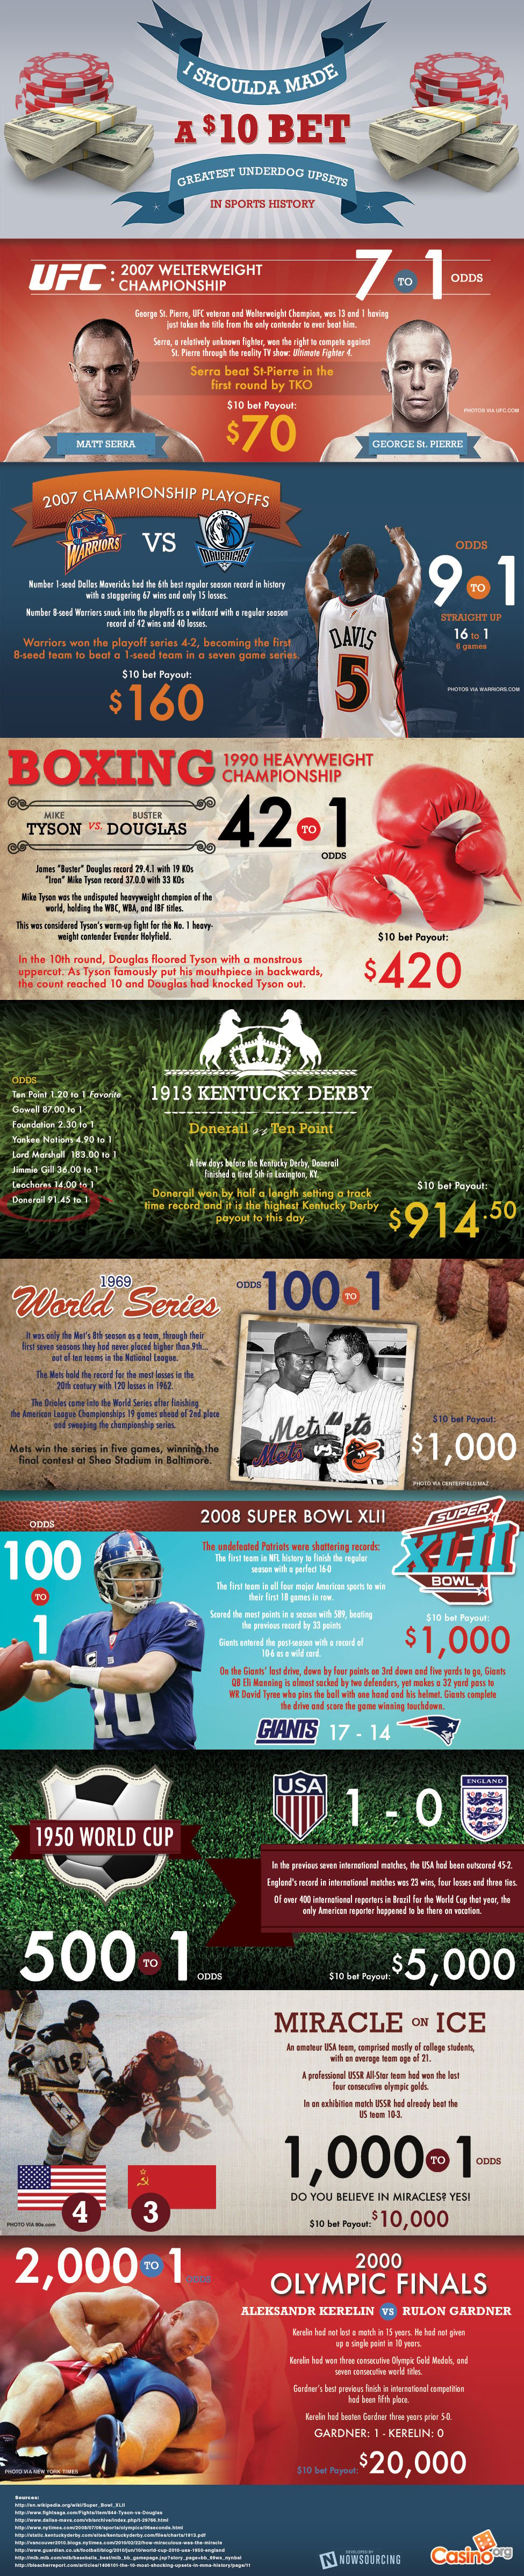
This is an infographic about the biggest underdogs in sports betting. It gives some information about various events from UFC fights to basketball games and states the odds and how much a $10 bet would have paid out.

Biggest Underdog Payouts

Thursday 22 November 2012

Women vs Men: Who Are the Better Investors?

Who do you think are better investors? Women or men? Well think no longer! This infographic goes through some interesting information including where they find their information, how they make their decisions and more. It was published by rplan.

Let's Talk About .sx

An infographic by 123 reg that talks about the .sx domain extension. .sx is the domain extension for Sint Maarten, a Dutch island in the carribean. The infographic talks a little about Sint Maarten and then gets a little rude!123-reg sx domain infographic

What's the Master in Management (MIM)?

This infographic from Master in Management Compass explains exactly what master in management programs are, who they are for and what impact they could have on your career. It is part of a study and all participating schools are listed at the bottom of the infographic. Masters in Management Study

Nambia: 10 Things You Didn’t Know

This infographic by My Destination introduces some interesting facts about Nambia that many people are unaware of. It includes information such as Nambia being home to the largest piece of meteor on earth (weighing 66 tonnes), Nambia being home to the world's oldest desert and much much more. Nambia: 10 Things You Didn't Know

Get More Out Of Google

An infographic created by HackCollege that is designed for students and aims to help them conduct research more effectively. Not only does this infographic explain how to get more out of Google, but also goes through some other effective research techniques like mining bibliographies. Get more out of Google

Tuesday 20 November 2012

The Flaccid Truth: Erectile Dysfunction

A somewhat embarrassing topic this time, this infographic by Doctor Fox goes through the common reasons for erectile dysfunction and explains you should go straight to your GP if you are experiencing erectile dysfunction yourself. I'm sure we can all agree with that prognosis! Erectile Dysfunction Infographic

Top 11 Features of Windows 8

This infographic goes through some features of Windows 8 according to Dot Com Infoway. As well as including the 11 features, the infographic presents some interesting statistics about Windows 8 usage on various devices and the pros and cons of the Windows 8 operating system. 11 features of windows 8

Sunday 18 November 2012

A how to guide on creating a lightsaber of your very own in the form of an infographic. It is very thorough and there is a list of all tools and materials required towards the top of the infographic. This infographic was created by Herbert Pocket.

How to Build a Lightsaber

Thursday 15 November 2012

How Clean is your Office?

A scary infographic that explains how easily germs can spread in offices. It goes through some of the most likely places germs will be and some ways to avoid spreading them. It certainly makes a case for finding good cleaning services!

Why You Need A Website

This infographic attempts to explain Why You Need a Website. It includes a range of interesting statistics including the world population that has access to the internet. The infographic was published by Sensible Internet Why You Need a Website

Friday 24 August 2012

Credits Cards Go Social!

Credit-Cards-Social-Infographic

"The Life Cycle Of A Plastic Bag"

Life Cycle of a Plastic Bag

Human Vs Animal


How To Care Pets In Hot Weather


Car Accident And What Cause Them?


How Dangerous Are Motorcycles!

Riding on a motorcycle, a small bump or object in the road can turn a fun ride to a tragic one. The odds are already stacked up against motorcyclists as 80% of motorcycle accidents involve injuries, as opposed to the 20% of car accidents. But that is to say the least, as other factors can also come into play if a collision does occur.
Infographic: Motorcycle Accidents
Infographic authored by Sutliff & Stout, motorcycle accident lawyers

Volunteers of America, Or Thrifting

This infographic is all about the benefits of thrifting! From helping the environment saving the massive amounts of water needed to grow the cotton for new garments, to saving money on those designer jeans you see in the department stores, to preventing 20 billion pounds of post-consumer textile waste. With the new school year getting ramped up, parents will be heading out to buy their kids some new duds, all the while hoping to save a little money. If parents take their kids thrifting instead of the mall - they can get all the clothes their children want AND save a ton of money in the process - which is a huge plus when they outgrow them in 6 months!

The Oakville Real Estate Market for July 2012

The Oakville Real Estate data for July has been released and we are continuing our infographic series with a quick look at home sales and statistics for the month of July. Home prices saw a major rise in July compared to July 2011 with an average $22,000 increase (3%). If you are thinking of buying or selling, we hope this might give you some insight into the current state of the Oakville real estate market and remember, the national trends you are currently hearing about in the media do not necessarily translate to the Oakville market as it tends to consistently outperform vs. the rest of Canada.
The Oakville Real Estate Market for July 2012 - Infographic by Krisztina Neglia Team
 By Krisztina Neglia Oakville Real Estate Agent

Thursday 23 August 2012

Video Games:Digital Vs Retail Sales

videogames_digital_sales

The Internet A Decade Later

Are You Ready To Visit Model Train Museums?

You can witness the winding journey of railroading, but you have to do it right. Model railroad museums allow everyone to enjoy and educate themselves on the rich history of railroading. New-comers and model train hobbyists alike find the awe behind the detail and displays in every museum, but if you haven’t experienced it yet, we can help. There are diverse museums around the country that showcase authentic and historical train sets, as well as other train treasures and must-sees. We’ve created a blueprint of what you need to know and where you should go in order to maximize the amazing. Before you chug along, check this out!
Visiting Model Train Museums?

Wednesday 22 August 2012

What Is PPI?

By now, we have all heard of the three infamous letters, PPI. The term has been repeated far and wide but do you really know the answer to 'what is PPI'and how it was mis-sold?

Summer Screen Time

School is out, its relatively warm and most of the time its not raining. It must be summer! However, how much time are today's children actually spending outside rather than sat inside in front of a screen? Here are the results of a study commissioned by Galt toys, who look into how kids spend their summer.

White Hat, Black Hat, Gray Hat, SEO

Historical Prices of Gasoline


How Big Is The SEO Industry On The Internet

Sunday 20 May 2012

Home Safes

http://www.safeoptions.co.uk/blog/wp-content/uploads/2012/02/Home-Safes-SafeOptions-Infographic.jpg

Get Your Electronics Organized!

This infographic provides a nice illustration of the various ways you can use the gadgets reviewed in this post to help organize your living space.
 
(Via @BundleCity)

Wednesday 4 April 2012

First Infographic on Top 5 Design Crowdsourcing Sites

Check the first infographic on top 5 Design Crowdsourcing sites which illustrates interesting facts and figures about top crowdsourcing sites like 99designs, Mycroburst and CrowdSpring.
first-infographic-top-crowdsourcing-sites

Monday 26 March 2012

U.S Basketball Participation

This infographic shows how the love of basketball in America is evident, not only in the number of people who watch the NCAA ® Tournaments, but in the number of Americans that play basketball as well. While only 1900 players made their way to the NCAA® Tournaments this year, 26.3 million Americans play basketball, whether in teams, leagues or simply pick-up games. Check out the stats about how people play basketball in the U.S., who makes it to the NCAA ® Tournaments and what is the probability of a filling out a perfect bracket. 
2012 NCAA® Tournaments Infographic - From Pick-Up Games to March Madness®
2012 NCAA® Tournaments Infographic - From Pick-Up Games to March Madness® by Goalrilla

Friday 9 March 2012

Mothers Day

The Smarter Way To File Your Taxes

The deadline to file taxes will be coming up sooner than you know, but choosing the right tax preparation service and keeping in mind commonly missed deductions will put you on the right path to filing your taxes smarter. Plus, The Smarter Way To File Your Taxes Infographic also highlights making good decisions on how to invest your refund check to boost next year's taxes.
taxes

Top 10 Scams Of The Year 2011