This infographic from The Tilsun Group helps you choose the right vehicle for surviving a zombie apocalypse. It goes through minivans, sports cars, 4x4s and more. It gives some stats and the pros and cons of each. Check it out:

This infographic from The Tilsun Group helps you choose the right vehicle for surviving a zombie apocalypse. It goes through minivans, sports cars, 4x4s and more. It gives some stats and the pros and cons of each. Check it out:
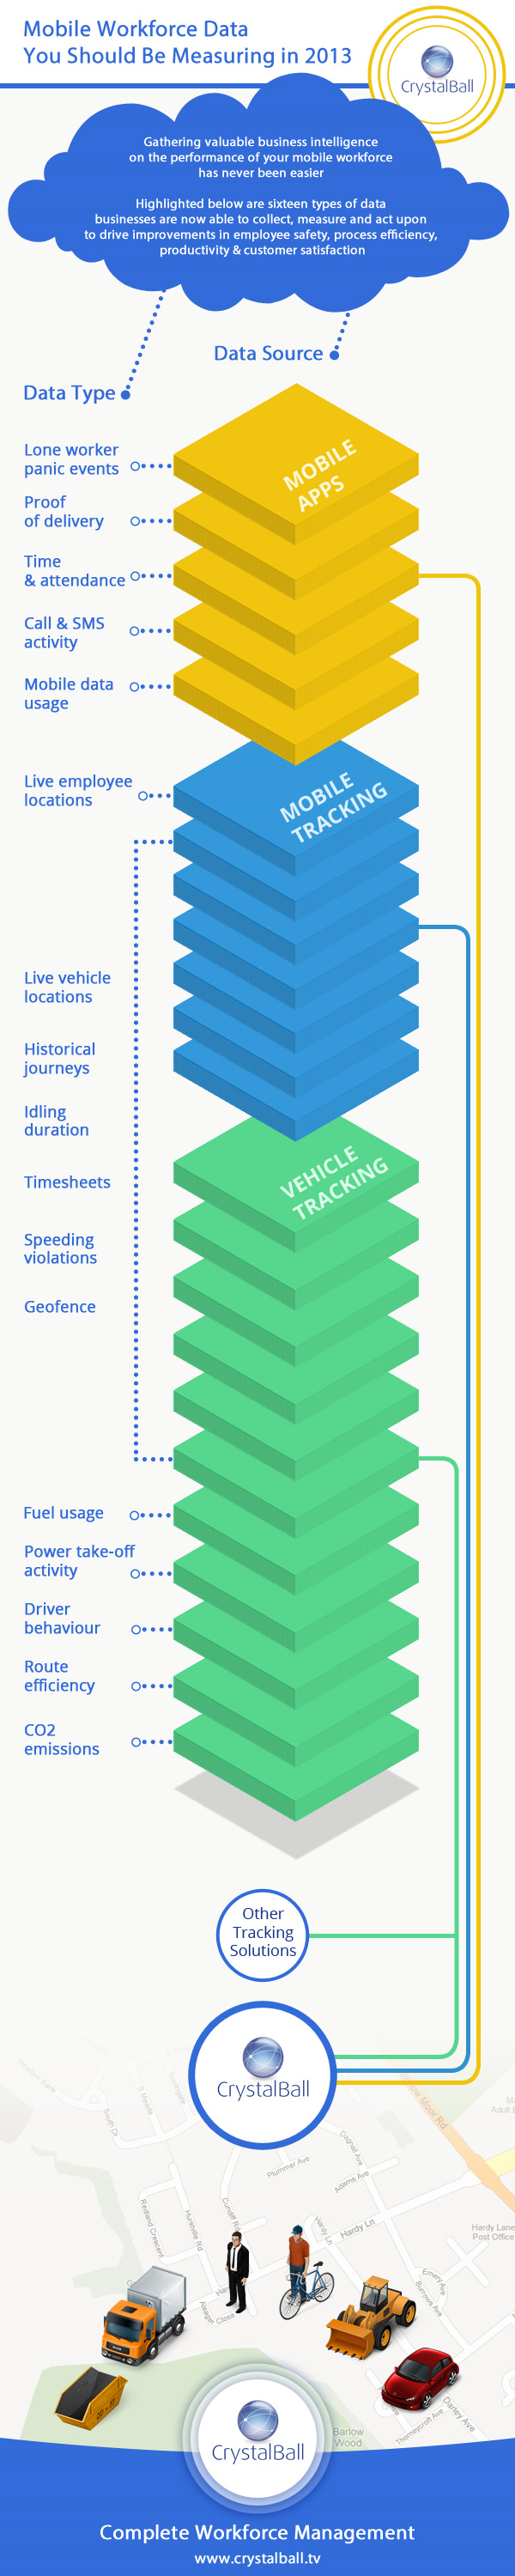
This infographic by CrystalBall introduces 16 types of machine to machine data. Examples of data introduced by the infographic that your business could be tracking are mobile data usage, live vehicle locations and fuel usage. Take a look:
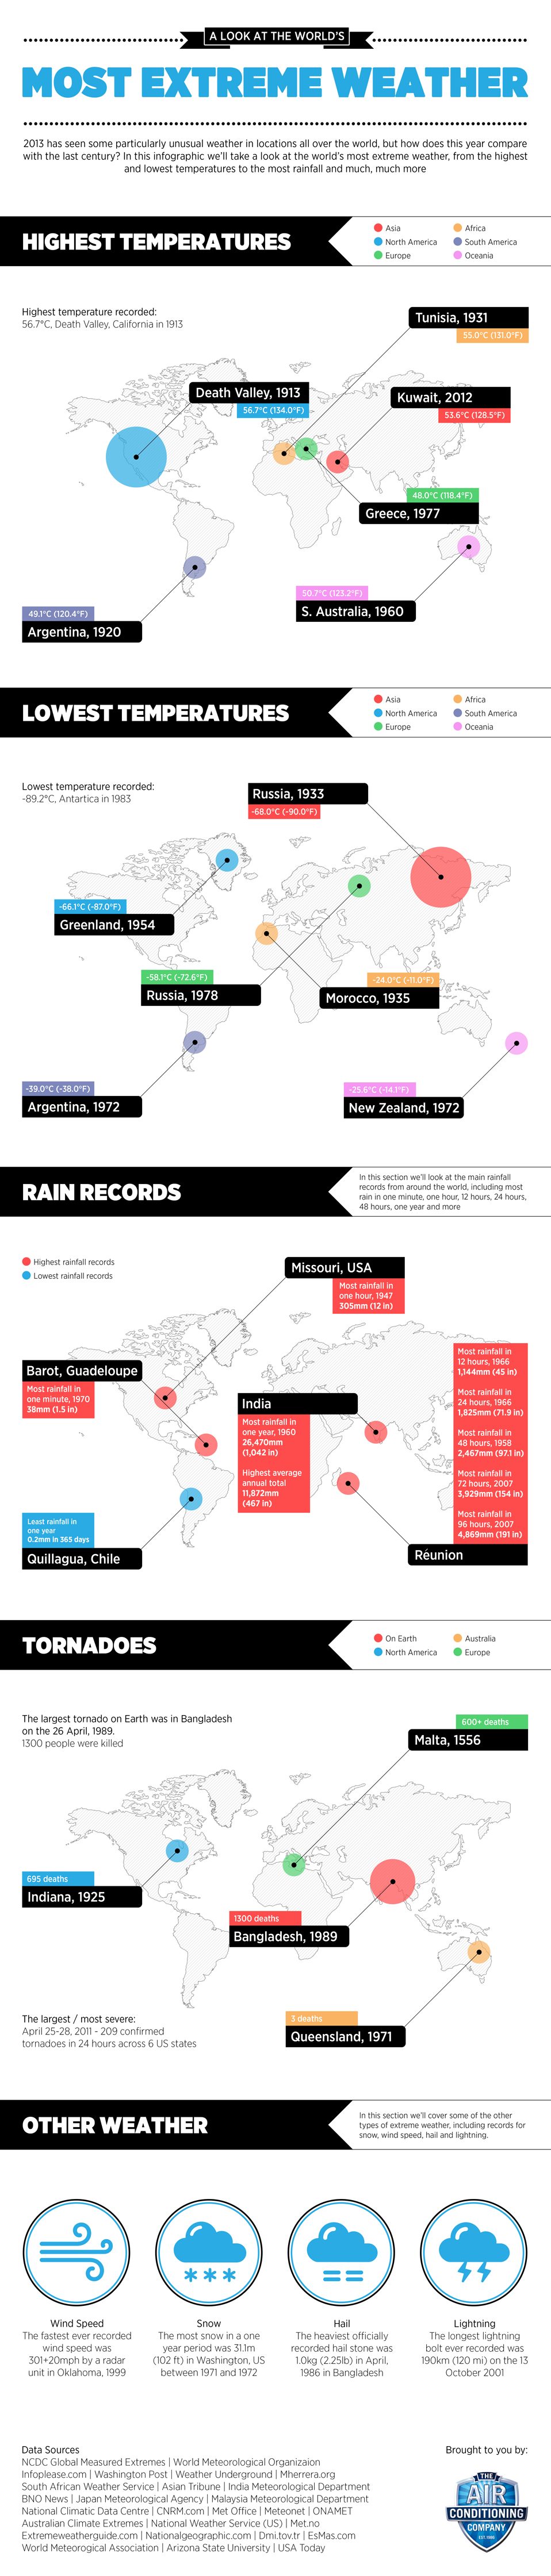
This infographic by The Air Conditioning Company takes a look at the worlds most extreme weather. It goes through highest and lowest temperature, rain records, tornadoes and more. Check it out:
This infographic by Motoring compares some of the features of the Ferrari LaFerrari, the Lamborghini Veneno and the McLaren P1. It goes through cost, acceleration, power and much more. Take a look:

This infographic by Fishfinger is actually about fish fingers. It introduces some interesting facts including the dictionary definition of fish fingers, how to say fish fingers in various languages, nutritional information and more.

This infographic by The Real Asset Co contains a timeline featuring various digital currencies. It talks about currencies such as e-gold and bitcoin. Check it out:

This infographic by Sandy Mount Hotel gives a profile of a modern travel blogger. It goes through the average age of a travel blogger, the gadgets they own, the destinations they visit, how to make money as a travel blogger and more. Take a look:
